(1)
State Street Corporation (“State Street”) has shared voting power with respect to 9,071,0028,469,960 shares and shared dispositive power with respect to 9,222,2368,760,151 shares. SSGA Funds Management, Inc. (“SSGA”), a subsidiary of State Street, has shared voting power with respect to 7,626,8506,938,049 shares and shared dispositive power with respect to 7,642,250 shares. The6,953,449 shares.The principal business address of State Street and SSGA and their related entities is State Street
Financial Center, 1 LincolnCongress Street, Suite 1, Boston, MA 02111.02114. The number of shares we have reported as beneficially owned by State Street and SSGA (and the other information in this footnote) is based on a Schedule 13G/A filed by State Street with the SEC on February 3, 2023April 10, 2024 reporting beneficial ownership as of DecemberMarch 31, 2022.
2024.
(2)
BlackRock, Inc. has sole voting power with respect to 7,048,219 shares and sole dispositive power over 7,338,742 shares. BlackRock, Inc.’s principal business address is 55 East 52nd Street, New York, NY 10055. The number of shares we have reported as beneficially owned by Blackrock, Inc. (and the other information in this footnote) is based on a Schedule 13G/A filed by BlackRock, Inc. with the SEC on January 26, 2023 reporting beneficial ownership as of December 31, 2022.
(3)
The Vanguard Group, Inc (“Vanguard”) has shared voting power with respect to 46,73749,285 shares, sole dispositive power with respect to 6,749,2348,345,941 shares and shared dispositive power with respect to 123,889115,760 shares. The principal business address of Vanguard and its related entities is 100 Vanguard Blvd., Malvern, PA 19355. The number of shares we have reported as beneficially owned by Vanguard (and the other information in this footnote) is based on a Schedule 13G/A filed by Vanguard with the SEC on February 9, 202313, 2024 reporting beneficial ownership as of December 30, 2022.29, 2023.
(3)BlackRock, Inc. has sole voting power with respect to 7,632,166 shares and sole dispositive power over 7,838,969 shares. BlackRock, Inc.’s principal business address is 50 Hudson Yards, New York, NY 10001. The number of shares we have reported as beneficially owned by BlackRock, Inc. (and the other information in this footnote) is based on a Schedule 13G/A filed by BlackRock, Inc. with the SEC on January 24, 2024 reporting beneficial ownership as of December 31, 2023.
(4)
(5)Consists of 26,9213,100 shares of common stock issuable upon the exercise of options exercisable within 60 days after April 4, 2023.
2, 2024.
(5)(6)
Consists of 8,24484,614 shares of common stock issuable upon the exercise of options exercisable within 60 days after April 4, 2023.
2, 2024.
(6)(7)
Consists of (i) 28,071 shares of common stock, (ii) 239,55966,488 shares of common stock issuable upon the exercise of options exercisable within 60 days after April 4, 2023,2, 2024.
(8)Consists of (i) 34,763 shares of common stock and (iii) 3,161(ii) 275,187 shares of common stock issuable upon the exercise of options exercisable within 60 days after April 2, 2024. The outstanding options held by Dr. Eaton will expire on January 2, 2025 pursuant to the terms of his separation agreement. The reported number of common shares held by Dr. Eaton is based on our records as of Dr. Eaton’s separation date on January 2, 2024, and does not take into account any transactions that may have occurred after such date.
(9)Consists of (i) 2,000 shares of common stock and (ii) 119,228 shares of common stock issuable upon the exercise of options exercisable within 60 days after April 2, 2024.
(10)Consists of (i) 22,700 shares of common stock and (ii) 107,690 shares of common stock issuable upon the exercise of options exercisable within 60 days after April 2, 2024.
(11)Consists of 16,667 shares of common stock issuable upon the exercise of options exercisable within 60 days after April 2, 2024.
(12)Consists of (i) 43,367 shares of common stock issuable upon the exercise of options exercisable within 60 days after April 2, 2024, (ii) 19,475 shares of common stock to be received upon the vesting of RSUs within 60 days after April 4, 2023.
2, 2024, and (iii) 25,966 shares of common stock to be received upon the vesting of PSUs within 60 days after April 2, 2024.
(7)(13)
Consists of (i) 2,00033,364 shares of common stock and (ii) 69,228100,768 shares of common stock issuable upon the exercise of options exercisable within 60 days after April 4, 2023.
2, 2024.
(8)(14)
Consists of (i) 22,70094,279 shares of common stock and (ii) 57,690515,396 shares of common stock issuable upon the exercise of options exercisable within 60 days after April 4, 2023.
2, 2024.
(9)(15)
Consists of (i) 75,898 shares of common stock and (ii) 388,13059,158 shares of common stock issuable upon the exercise of options exercisable within 60 days after April 4, 2023.
2, 2024.
(10)(16)
Consists of (i) 237,55230,971 shares of common stock and (ii) 181,046 shares of common stock issuable upon the exercise of options exercisable within 60 days after April 4,2, 2024. The outstanding options held by Ms. Robertson will expire on August 16, 2024 pursuant to the terms of her separation agreement. The reported number of common shares held by
Ms. Robertson is based on our records as of Ms. Robertson’s separation date on August 16, 2023, and does not take into account any transactions that may have occurred after such date.
(17)Consists of 96,152 shares of common stock issuable upon the exercise of options exercisable within 60 days after April 2, 2024.
(18)Consists of 130,766 shares of common stock issuable upon the exercise of options exercisable within 60 days after April 2, 2024.
(19)Consists of (i) 152,343 shares of common stock, (ii) 21,6641,343,394 shares of common stock issuable upon the exercise of options exercisable within 60 days after April 2, 2024, (iii) 19,475 shares of common stock to be received upon the vesting of RSUs within 60 days after April 4, 2023.
(11)
Consists of 4,579 shares of common stock issuable upon the exercise of options exercisable within 60 days after April 4, 2023.
(12)
Consists of (i) 25,782 shares of common stock, (ii) 162,355 shares of common stock issuable upon the exercise of options exercisable within 60 days after April 4, 2023,2, 2024, and (iii) 3,988(iv) 25,966 shares of common stock to be received upon the vesting of RSUsPSUs within 60 days after April 4, 2023.2, 2024.
69
(13)
Consists of 46,152 shares of common stock issuable upon the exercise of options exercisable within 60 days after April 4, 2023.
(14)
Consists of (i) 17,252 shares of common stock and (ii) 54,447 shares of common stock issuable upon the exercise of options exercisable within 60 days after April 4, 2023. The outstanding options held by Dr. Shearman will expire on June 30, 2023, the date that is three months after his separation date, if not exercised prior to such date.
(15)
Consists of 80,766 shares of common stock issuable upon the exercise of options exercisable within 60 days after April 4, 2023.
(16)
Consists of (i) 154,451 shares of common stock, (ii) 1,321,176 shares of common stock issuable upon the exercise of options exercisable within 60 days after April 4, 2023, and (iii) 28,813 shares of common stock to be received upon the vesting of RSUs within 60 days after April 4, 2023.
REPORT OF THE AUDIT COMMITTEE
The Audit Committee has reviewed our audited financial statements for the year ended December 31, 20222023 and discussed them with our management and our independent registered public accounting firm, Ernst &Young LLP.
The Audit Committee has also received from, and discussed with, Ernst &Young LLP various communications that Ernst &Young LLP is required to provide to the Audit Committee, including the matters required to be discussed by the applicable requirements of the Public Company Accounting Oversight Board and the Securities and Exchange Commission.
In addition, Ernst & Young LLP provided the Audit Committee with the written disclosures and the letter required by applicable requirements of the Public Company Accounting Oversight Board regarding the independent registered public accounting firm’s communications with the Audit Committee concerning independence, and the Audit Committee has discussed with the company’s independent registered public accounting firm their independence.
Based on the review and discussions referred to above, the Audit Committee recommended to our Board that our financial statements audited by Ernst & Young LLP be included in our Annual Report on Form 10-K for the year ended December 31, 2022.2023.
| | | | | |
| By the Audit Committee of the board of directors of the board of directors of Editas Medicine, Inc. |
| |
| Emma Reeve, Chair Meeta Chatterjee, Ph.D. Andrew Hirsch Emma Reeve, Chair
Meeta Chatterjee, Ph.D.
Andrew Hirsch
Jessica Hopfield, Ph.D.
Elliott Levy, M.D. |
PROPOSAL 2—ADVISORY VOTE ON EXECUTIVE COMPENSATION
We are providing our stockholders the opportunity to vote to approve, on an advisory, non-binding basis, the compensation of our named executive officers as disclosed in this Proxy Statement in accordance with the SEC’s rules. This proposal, which is commonly referred to as “say-on-pay,” is required by the Dodd-Frank Wall Street Reform (the “Dodd-Frank Act”)Act and Consumer Protection Act of 2010, which added Section 14A to the Securities Exchange Act of 1934 (the “Exchange Act”). Our executive compensation program is designed to attract and retain qualified and talented executives, motivate such executives to achieve our business goals and reward them for short- and long-term performance with a simple and clear compensation structure. Under this program, our named executive officers are rewarded for the achievement of our short- and long-term performance, which we believe serves to enhance short- and long-term value creation for our stockholders. The program contains elements of cash and equity-based compensation and are designed to align the interests of our executives with those of our stockholders and paying for performance.
The section of this Proxy Statement titled “Executive Compensation,” including “Compensation Discussion and Analysis,” describes in detail our executive compensation program and the decisions made by the the Organization, Leadership and Compensation Committee.Committee of our Board (the “Compensation Committee”). As we describe in greater detail in the “Compensation Discussion and Analysis” section, our executive compensation program rewards value creation for stockholders and progress towards achieving our business goals and that promotes company performance. At the same time, we believe our program does not encourage excessive risk-taking by management. While we do not have a formal or informal policy for allocating between long-term and short-term compensation, between cash and non-cash compensation or among different forms of non-cash compensation, we generally strive to provide our named executive officers with a mix of short-term and long-term performance-based incentives to encourage consistently strong performance, and our Board believes that this link between compensation and the achievement of our near- and long-term business goals has helped drive our performance over time.
Our Board is asking stockholders to approve a non-binding advisory vote on the following resolution:
RESOLVED, that the compensation paid to the company’s named executive officers, as disclosed pursuant to the compensation disclosure rules of the Securities and Exchange Commission, including the compensation discussion and analysis, the compensation tables and any related material disclosed in this Proxy Statement, is hereby approved.
As an advisory vote, this proposal is not binding. The outcome of this advisory vote does not overrule any decision by us or our Board (or any committee thereof), create or imply any change to the fiduciary duties of our company or our Board (or any committee thereof), or create or imply any additional fiduciary duties for our company or our Board (or any committee thereof). However, the Compensation Committee and Board value the opinions expressed by our stockholders in their vote on this proposal and intend to consider carefully the outcome of the vote when making future compensation decisions for named executive officers. In 2019, our Board recommended, our stockholders agreed and our Board thereafter concluded that our stockholders cast an advisory vote annually on the executive compensation of our named executive officers. The next stockholder advisory “say-on-frequency” vote will occur at our 2025 annual meeting of stockholders.
Recommendation of the Board of Directors
OUR BOARD OF DIRECTORS RECOMMENDS THAT STOCKHOLDERS VOTE TO APPROVE THE COMPENSATION PAID TO OUR NAMED EXECUTIVE OFFICERS BY VOTING ‘FOR’ THIS PROPOSAL.
PROPOSAL NO. 3—RATIFICATION OF THE APPOINTMENT OF ERNST & YOUNG LLP
AS OUR INDEPENDENT REGISTERED PUBLIC ACCOUNTING FIRM FOR THE
FISCAL YEAR ENDING DECEMBER 31, 20232024
Our stockholders are being asked to ratify the appointment by the Audit Committee of Ernst & Young LLP as our independent registered public accounting firm for the fiscal year ending December 31, 2023.2024.
The Audit Committee is solely responsible for selecting our independent registered public accounting firm for the fiscal year ending December 31, 2023.2024. Stockholder approval is not required to appoint Ernst & Young LLP as our independent registered public accounting firm. However, our Board believes that submitting the appointment of Ernst & Young LLP to the stockholders for ratification is good corporate governance. If the stockholders do not ratify this appointment, the Audit Committee will reconsider whether to retain Ernst & Young LLP. If the selection of Ernst & Young LLP is ratified, the Audit Committee, in its discretion, may direct the appointment of a different independent registered public accounting firm at any time it decides that such a change would be in the best interest of our company and our stockholders.
A representative of Ernst & Young LLP is expected to attend the virtual Annual Meeting and will have an opportunity to make a statement if he or she desires to do so and to respond to appropriate questions from our stockholders.
Audit Fees
We incurred the following fees from Ernst & Young LLP for the audit of the consolidated financial statements and for other services provided during the years ended December 31, 20222023 and 2021.2022.
| | | | | 2022 | | | 2021 | |
| | Audit fees(1) | | | | $ | 900,390 | | | | | $ | 896,010 | | |
| | Audit-related fees | | | | | — | | | | | | — | | |
| | Tax fees(2) | | | | | 20,000 | | | | | | 23,995 | | |
| | All other fees | | | | | — | | | | | | — | | |
| | Total fees | | | | $ | 920,390 | | | | | $ | 920,005 | | |
| | | | | | | | |
| 2023 | 2022 |
| Audit fees(1) | $ | 954,250 | | $ | 900,390 | |
| Audit-related fees | — | | — | |
| Tax fees(2) | 25,750 | | 20,000 | |
| All other fees | — | | — | |
| | |
| Total fees | $ | 980,000 | | $ | 920,390 | |
(1)
Audit fees consist of fees for the audit of our annual financial statements, the review of the interim financial statements included in our quarterly reports on Form 10-Q, and other professional services provided in connection with registration statements filed with the SEC.
(2)
Tax fees consist of fees for professional services performed by Ernst & Young LLP with respect to tax compliance, tax advice, and tax planning.
The aggregate fees included in the Audit Fees are those billed for the fiscal year and the Tax Fees are those fees billed in the fiscal year.
Audit Committee Pre-Approval Policy and Procedures
The Audit Committee has adopted policies and procedures for the pre-approval of audit and non-audit services for the purpose of maintaining the independence of our independent auditor. We may not engage our independent auditor to render any audit or non-audit service unless either the service is approved in advance by the Audit Committee, or the engagement to render the service is entered into pursuant to the Audit Committee’s pre-approval policies and procedures. Notwithstanding the foregoing, pre-approval is not required with respect to the provision of services, other than audit, review or attest services, by the independent auditor if the aggregate amount of all such services is no more than 5% of the total amount paid by us to the independent auditor during the fiscal year in which the services are provided, such services were not recognized by us at the time of the engagement to be non-audit services and such services are promptly brought to the attention of the Audit Committee and approved prior to completion of the audit by the Audit Committee.
From time to time, the Audit Committee may pre-approve services that are expected to be provided to us by the independent auditor during the following 12 months. At the time such pre-approval is granted, the
Audit Committee must identify the particular pre-approved services in a sufficient level of detail so that our management will not be called upon to make a judgment as to whether a proposed service fits within the pre-approved services and, at each regularly scheduled meeting of the Audit Committee following such approval, management or the independent auditor shall report to the Audit Committee regarding each service actually provided to us pursuant to such pre-approval. The Audit Committee has delegated to its chair the authority to grant pre-approvals of audit or non-audit services to be provided by the independent
auditor. Any approval of services by the chair of the Audit Committee is reported to the committee at its next regularly scheduled meeting.
During our 20222023 and 20212022 fiscal years, no services were provided to us by Ernst & Young LLP other than in accordance with the pre-approval policies and procedures described above.
Recommendation of the Board of Directors
OUR BOARD OF DIRECTORS RECOMMENDS VOTING “FOR” PROPOSAL NO. 3 TO RATIFY THE APPOINTMENT OF ERNST & YOUNG LLP AS OUR INDEPENDENT REGISTERED PUBLIC ACCOUNTING FIRM FOR THE FISCAL YEAR ENDING DECEMBER 31, 2023.2024.
HOUSEHOLDING
HOUSEHOLDING
Some banks, brokers and other nominee record holders may be participating in the practice of “householding” proxy statements, annual reports, and notices of Internet availability of proxy materials. This means that only one copy of our documents, including the Notice, may have been sent to multiple stockholders in your household.who share an address. We will promptly deliver a separate copy of any such document to you upon written or oral request to Editas Medicine, Inc., 11 Hurley Street, Cambridge, Massachusetts 02141, Attention: Investor Relations, telephone: 617-401-9000. If you want to receive separate copies of our proxy statements, annual reports, or notices of Internet availability of proxy materials in the future, or if you are receiving multiple copies and would like to receive only one copy per household, you should contact your bank, broker or other nominee record holder, or you may contact us at the above address and phone number.
STOCKHOLDER PROPOSALS
STOCKHOLDER PROPOSALS
A stockholder who would like to have a proposal considered for inclusion in our 20242025 proxy statement must submit the proposal in accordance with the procedures outlined in Rule 14a-8 of the Exchange Act so that it is received by us no later than December 27, 2023.17, 2024. However, if the date of the 20242025 annual meeting of stockholders is changed by more than 30 days from the date of the previous year’s meeting, then the deadline is a reasonable time before we begin to print and send our proxy statement for the 20242025 annual meeting of stockholders. SEC rules set standards for eligibility and specify the types of stockholder proposals that may be excluded from a proxy statement. Stockholder proposals should be addressed to Editas Medicine, Inc., 11 Hurley Street, Cambridge, Massachusetts 02141, Attention: General Counsel, Secretary.
If a stockholder wishes to propose a nomination of persons for election to our Board or present a proposal at an annual meeting but does not wish to have the proposal considered for inclusion in our proxy statement and proxy card, our amended and restated by-laws (our “By-Laws”) establish an advance notice procedure for such nominations and proposals. Stockholders at an annual meeting may only consider proposals or nominations specified in the notice of meeting or brought before the meeting by or at the direction of our Board or by a stockholder of record on the record date for the meeting, who is entitled to vote at the meeting and who has delivered timely notice in proper form to our corporate secretary of the stockholder’s intention to bring such business before the meeting.
The required notice must be in writing and received by our corporate secretary at our principal executive offices not less than 90 days nor more than 120 days prior to the first anniversary of the preceding year’s annual meeting. However, in the event that the date of the annual meeting is advanced by more than 30 days, or delayed by more than 60 days, from the first anniversary of the preceding year’s annual meeting, a stockholder’s notice must be so received no earlier than the 120th day prior to such annual meeting and not later than the close of business on the later of (A) the 90th day prior to such annual meeting and (B) the tenth day following the day on which notice of the date of such annual meeting was given or public disclosure of the date of such annual meeting was made, whichever first occurs. For stockholder proposals to be brought before the 20242025 annual meeting of stockholders, the required notice must be received by our corporate secretary at our principal executive offices no earlier than February 2, 2024January 30, 2025 and no later than March 3, 2024.1, 2025. Stockholders are advised to review our bylaws which also specify requirements as to the form and content of a stockholder’s notice, including the information required by Rule 14a-19 under the Exchange Act.
OTHER MATTERS
Our Board does not know of any other matters to be brought before the Annual Meeting. If any other matters not mentioned in this Proxy Statement are properly brought before the meeting, the individuals named in the enclosed proxy intend to use their discretionary voting authority under the proxy to vote the proxy in accordance with their best judgment on those matters.
![[MISSING IMAGE: px_scan01-bw.jpg]](https://capedge.com/proxy/DEF 14A/0001104659-23-046732/px_scan01-bw.jpg)
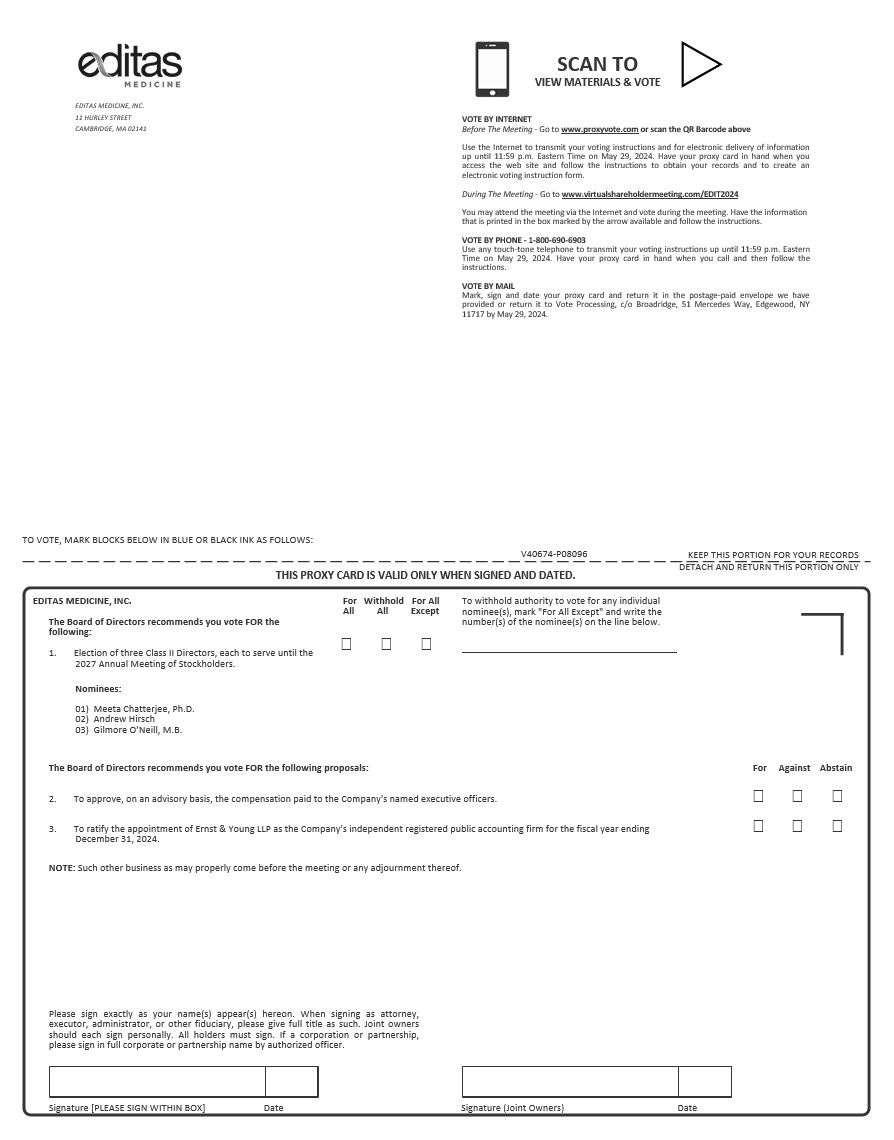
SCAN TOVIEW MATERIALS & VOTEEDITAS MEDICINE, INC.11 HURLEY STREETVOTE BY INTERNETCAMBRIDGE, MA 02141Before The Meeting - Go to www.proxyvote.com or scan the QR Barcode aboveUse the Internet to transmit your voting instructions and for electronic delivery ofinformation up until 11:59 p.m. Eastern Time the day before the cut-off date or meetingdate. Have your proxy card in hand when you access the web site and follow theinstructions to obtain your records and to create an electronic voting instruction form.During The Meeting - Go to www.virtualshareholdermeeting.com/EDIT2023You may attend the meeting via the Internet and vote during the meeting. Have theinformation that is printed in the box marked by the arrow available and follow theinstructions.VOTE BY PHONE - 1-800-690-6903Use any touch-tone telephone to transmit your voting instructions up until 11:59 p.m.Eastern Time the day before the cut-off date or meeting date. Have your proxy card inhand when you call and then follow the instructions.VOTE BY MAILMark, sign and date your proxy card and return it in the postage-paid envelope we haveprovided or return it to Vote Processing, c/o Broadridge, 51 Mercedes Way, Edgewood,NY 11717. TO VOTE, MARK BLOCKS BELOW IN BLUE OR BLACK INK AS FOLLOWS:V09382-P88814THIS PROXY CARD IS VALID ONLY WHEN SIGNED AND DATED.EDITAS MEDICINE, INC.For WithholdFor AllTo withhold authority to vote for any individualAllAllExceptnominee(s), mark "For All Except" and write theThe Board of Directors recommends you vote FOR thenumber(s) of the nominee(s) on the line below.following: KEEP THIS PORTION FOR YOUR RECORDS DETACH AND RETURN THIS PORTION ONLY 1.Election of three Class I Directors, each to serve until the 2026 Annual Meeting of Stockholders.Nominees:01) Bernadette Connaughton02) Elliott Levy, M.D.03) Akshay Vaishnaw, M.D.The Board of Directors recommends you vote FOR the following proposals:For Against Abstain 2.To approve, on an advisory basis, the compensation paid to the Company's named executive officers. 3.To ratify the appointment of Ernst & Young LLP as the Company's independent registered public accounting firm for the fiscal year ending December 31, 2023. NOTE: Such other business as may properly come before the meeting or any adjournment thereof.Please sign exactly as your name(s) appear(s) hereon. When signing as attorney, executor, administrator, or other fiduciary, please give full title as such. Joint owners should each sign personally. All holders must sign. If a corporation or partnership, please sign in full corporate or partnership name by authorized officer.Signature [PLEASE SIGN WITHIN BOX]DateSignature (Joint Owners)Date
![[MISSING IMAGE: px_scan02-bw.jpg]](https://capedge.com/proxy/DEF 14A/0001104659-23-046732/px_scan02-bw.jpg)
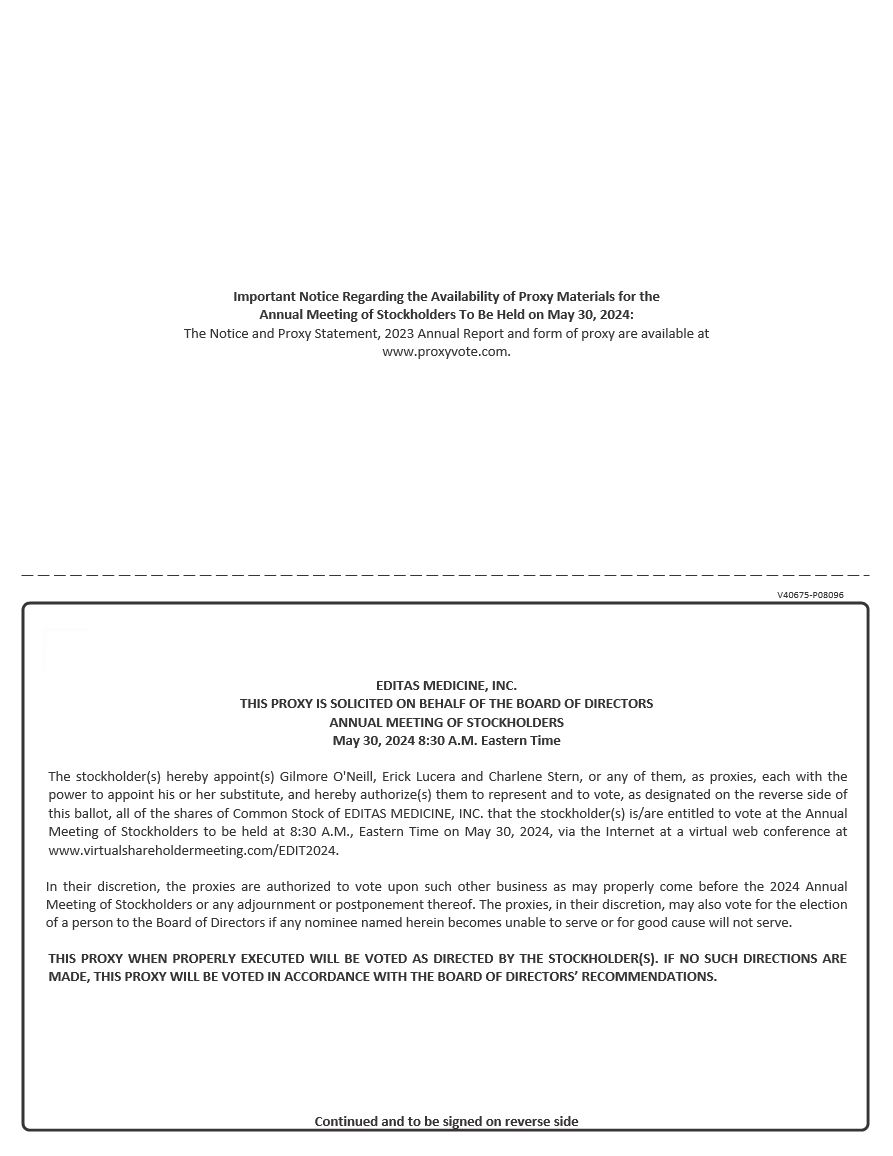
Important Notice Regarding the Availability of Proxy Materials for theAnnual Meeting of Stockholders To Be Held on June 1, 2023:The Notice and Proxy Statement, 2022 Annual Report and form of proxy are available atwww.proxyvote.com.V09383-P88814EDITAS MEDICINE, INC.THIS PROXY IS SOLICITED ON BEHALF OF THE BOARD OF DIRECTORS ANNUALMEETING OF STOCKHOLDERSJUNE 1, 2023 8:30 A.M. Eastern TimeThe stockholder(s) hereby appoint(s) Gilmore O'Neill, Michelle Robertson and Charlene Stern, or any of them, as proxies, each with the power to appoint his or her substitute, and hereby authorize(s) them to represent and to vote, as designated on the reverse side of this ballot, all of the shares of Common Stock of EDITAS MEDICINE, INC. that the stockholder(s) is/are entitled to vote at the Annual Meeting of Stockholders to be held at 8:30 A.M., Eastern Time on June 1, 2023, via the Internet at a virtual web conference at www.virtualshareholdermeeting.com/EDIT2023.In their discretion, the proxies are authorized to vote upon such other business as may properly come before the meeting or any adjournment or postponement thereof. The proxies, in their discretion, may also vote for the election of a person to the Board of Directors if any nominee named herein becomes unable to serve or for good cause will not serve.THIS PROXY WHEN PROPERLY EXECUTED WILL BE VOTED AS DIRECTED BY THE STOCKHOLDER(S). IF NO SUCH DIRECTIONS ARE MADE, THIS PROXY WILL BE VOTED IN ACCORDANCE WITH THE BOARD OF DIRECTORS’ RECOMMENDATIONS.Continued and to be signed on reverse side
0001650664 2022-12-31


![[MISSING IMAGE: pc_ceoneo-pn.jpg]](https://capedge.com/proxy/DEF 14A/0001104659-23-046732/pc_ceoneo-pn.jpg)
![[MISSING IMAGE: ph_bernadetteconnaugh-4clr.gif]](https://capedge.com/proxy/DEF 14A/0001104659-23-046732/ph_bernadetteconnaugh-4clr.gif)

![[MISSING IMAGE: ph_elliottlevy-4clr.gif]](https://capedge.com/proxy/DEF 14A/0001104659-23-046732/ph_elliottlevy-4clr.gif)
![[MISSING IMAGE: ph_akshayvaishnaw-4clr.gif]](https://capedge.com/proxy/DEF 14A/0001104659-23-046732/ph_akshayvaishnaw-4clr.gif)
![[MISSING IMAGE: ph_meetachatterjee-4clr.gif]](https://capedge.com/proxy/DEF 14A/0001104659-23-046732/ph_meetachatterjee-4clr.gif)
![[MISSING IMAGE: ph_andrewhirsch-4c.gif]](https://capedge.com/proxy/DEF 14A/0001104659-23-046732/ph_andrewhirsch-4c.gif)

![[MISSING IMAGE: ph_gilmoreneill-4clr.gif]](https://capedge.com/proxy/DEF 14A/0001104659-23-046732/ph_gilmoreneill-4clr.gif)

![[MISSING IMAGE: ph_jessicahopfield-4clr.gif]](https://capedge.com/proxy/DEF 14A/0001104659-23-046732/ph_jessicahopfield-4clr.gif)

![[MISSING IMAGE: ph_emmareeve-4clr.gif]](https://capedge.com/proxy/DEF 14A/0001104659-23-046732/ph_emmareeve-4clr.gif)

![[MISSING IMAGE: ph_davidscadden-4clr.gif]](https://capedge.com/proxy/DEF 14A/0001104659-23-046732/ph_davidscadden-4clr.gif)


![[MISSING IMAGE: ph_bruceeaton-4clr.gif]](https://capedge.com/proxy/DEF 14A/0001104659-23-046732/ph_bruceeaton-4clr.gif)


![[MISSING IMAGE: ph_baisongmei-4clr.gif]](https://capedge.com/proxy/DEF 14A/0001104659-23-046732/ph_baisongmei-4clr.gif)

![[MISSING IMAGE: ph_michellerobertson-4clr.gif]](https://capedge.com/proxy/DEF 14A/0001104659-23-046732/ph_michellerobertson-4clr.gif)
![[MISSING IMAGE: tbl_skills-pn.jpg]](https://capedge.com/proxy/DEF 14A/0001104659-23-046732/tbl_skills-pn.jpg)
![[MISSING IMAGE: pc_independence-pn.jpg]](https://capedge.com/proxy/DEF 14A/0001104659-23-046732/pc_independence-pn.jpg)

![[MISSING IMAGE: pc_tenure-pn.jpg]](https://capedge.com/proxy/DEF 14A/0001104659-23-046732/pc_tenure-pn.jpg)

![[MISSING IMAGE: pc_diversity-pn.jpg]](https://capedge.com/proxy/DEF 14A/0001104659-23-046732/pc_diversity-pn.jpg)
![[MISSING IMAGE: pc_age-pn.jpg]](https://capedge.com/proxy/DEF 14A/0001104659-23-046732/pc_age-pn.jpg)


![[MISSING IMAGE: bc_captsr-pn.jpg]](https://capedge.com/proxy/DEF 14A/0001104659-23-046732/bc_captsr-pn.jpg)
![[MISSING IMAGE: bc_netloss-pn.jpg]](https://capedge.com/proxy/DEF 14A/0001104659-23-046732/bc_netloss-pn.jpg)
